
How Much Plant Fiber Is Actually Effective? WOOYOPET Releases a Feasibility Survey on Plastic-Reducing Materials
Survey evidence from 120 material projects, 50 B2B contacts and 200 consumers reveals a practical gap: engineering adoption peaked at 15–20% plant content, while consumers most often preferred 20–30% with normal performance. The right percentage depends on processing, product life and measurable polymer displacement.
Buyer and engineer FAQ
Questions about choosing a plant-fiber fraction
Is 15–20% the best plant-fiber loading for every product?
No. It had the highest advancement rate in this set of 120 project records. A target must be validated on the actual part, resin, mold, processing route and end-use requirements.
Why do consumers prefer 20–30%?
It was the most selected option among 200 respondents when normal everyday performance was maintained. The survey records stated preference, not a controlled purchase or performance test.
Does 25% plant content mean 25% less carbon?
No. A plant fraction can support a polymer-mass substitution estimate if the finished-part composition and baseline are known. Carbon changes require a defined life-cycle assessment.
What must be checked before increasing loading?
Test moisture, impact and structural performance, flow and mold filling, dimensional stability, color, odor, feeding, product life and finished-article requirements.
Use finished-part data and a defined conventional baseline before publishing a project-level claim.
Plant-fiber composites are being used more and more often for the goal of "reducing plastic". But once a project actually enters material development, a question that looks simple quickly becomes complicated: how much plant fiber should be added?
If the question is understood only as replacing petroleum-based material, the answer seems straightforward. A 10% plant fraction is less than 20%, 20% is less than 30%, and if 50% were achievable it would theoretically mean that more conventional polymer has been replaced by plant-derived material. Real manufacturing, however, is not a simple mass swap. As the plant fraction keeps rising, water uptake, impact performance, flow, dimensional stability, color, odor, feeding and the processing window can all change with it. The plastic-reduction benefit of a higher plant fraction does not stay in step with product manufacturability indefinitely.
What plant-fiber composites therefore really need to answer is not "how much plant can we add at most", but a question with more industrial meaning: while the product can still be manufactured reliably, used normally and accepted by the market, how much plant fiber is genuinely effective at reducing plastic?
Around this question, WOOYOPET divided the scope of observation into three levels: material development projects, brand and manufacturing customers, and end consumers. The project side covers 120 plant-fiber material projects that reached customer validation; the B2B side covers 50 brand, manufacturing company and project contacts; the consumer side uses 200 valid responses, of which 100 are in China, 60 in Europe and the Americas and 40 in other regions.
These three samples do not answer the same question. Material projects tell us which fractions are easier to make; B2B customers answer under which conditions companies will really adopt them; consumers decide how far the market wants plastic reduction to go, and which differences they are willing to accept for that change.
When the three datasets are placed together, a key gap appears: the band that is easiest for engineering to advance is concentrated at 15–20%, while the option consumers most prefer is 20–30%. That five-to-ten-point difference may be exactly the space most worth studying as plant-fiber composites move from environmental wishes toward manufacturing at scale.
1. Survey design: three samples answer three questions
This survey uses three independent samples:
- Material side: 120 plant-fiber material projects that reached customer validation. If the same project compared several plants, each plant was counted separately, so plant-source coverage may be counted more than once.
- B2B side: 50 brand, manufacturing company, purchasing, R&D or project leads.
- Consumer side: 200 valid consumers, of which 100 are in China, 60 in Europe and the Americas and 40 in other regions — that is, 50% China, 30% Europe and the Americas and 20% other regions.
The consumer sample and the B2B sample are independent and do not contain each other. All percentage questions in this article are calculated as the number of respondents choosing an option divided by the valid total for that question; the percentages of a multi-select question can therefore add up to more than 100%. The "petroleum-based material displacement" in the product cases is calculated with a mass model: product weight × plant fraction × annual production volume. That indicator describes mass substitution of material and is not directly equivalent to a carbon-emission reduction rate.
2. The engineering sweet spot: 15–20%
Across the 120 material development projects, the plant fraction did not show a linear relationship in which "the higher, the easier to win customer approval".
There were 12 projects below 10% plant content: 11 of them could be processed stably, a stable-processing rate of 91.7%, but only 8 went on to further customer validation or actual use, an advancement rate of 66.7%. In the 10–15% band, 17 of 18 projects could be processed stably and 14 went on, lifting the project advancement rate to 77.8%.
The strongest performance came in the 15–20% band. Of 31 projects, 29 could be processed stably, a stable-processing rate of 93.5%, and 25 of them went on to customer validation or actual use, an advancement rate of 80.6% — the highest level of any plant-content band.
From 20% upward, however, the curve clearly changes. At 20–25%, 83.3% of projects could still be processed stably, but the share that went on to advance fell to 62.5%. Once plant content rose to 25–30%, the stable-processing rate dropped further to 75.0% and the rate of continued validation or use was only 43.8%. In the 30–40% band, only 7 of 11 projects could be processed stably and only 3 went on, equivalent to 27.3%.
Above 40% plant content, project risk grew further. Only 2 of the 5 projects at 40–50% could be processed stably and only 1 went on; of the 3 projects above 50%, none reached stable processing.
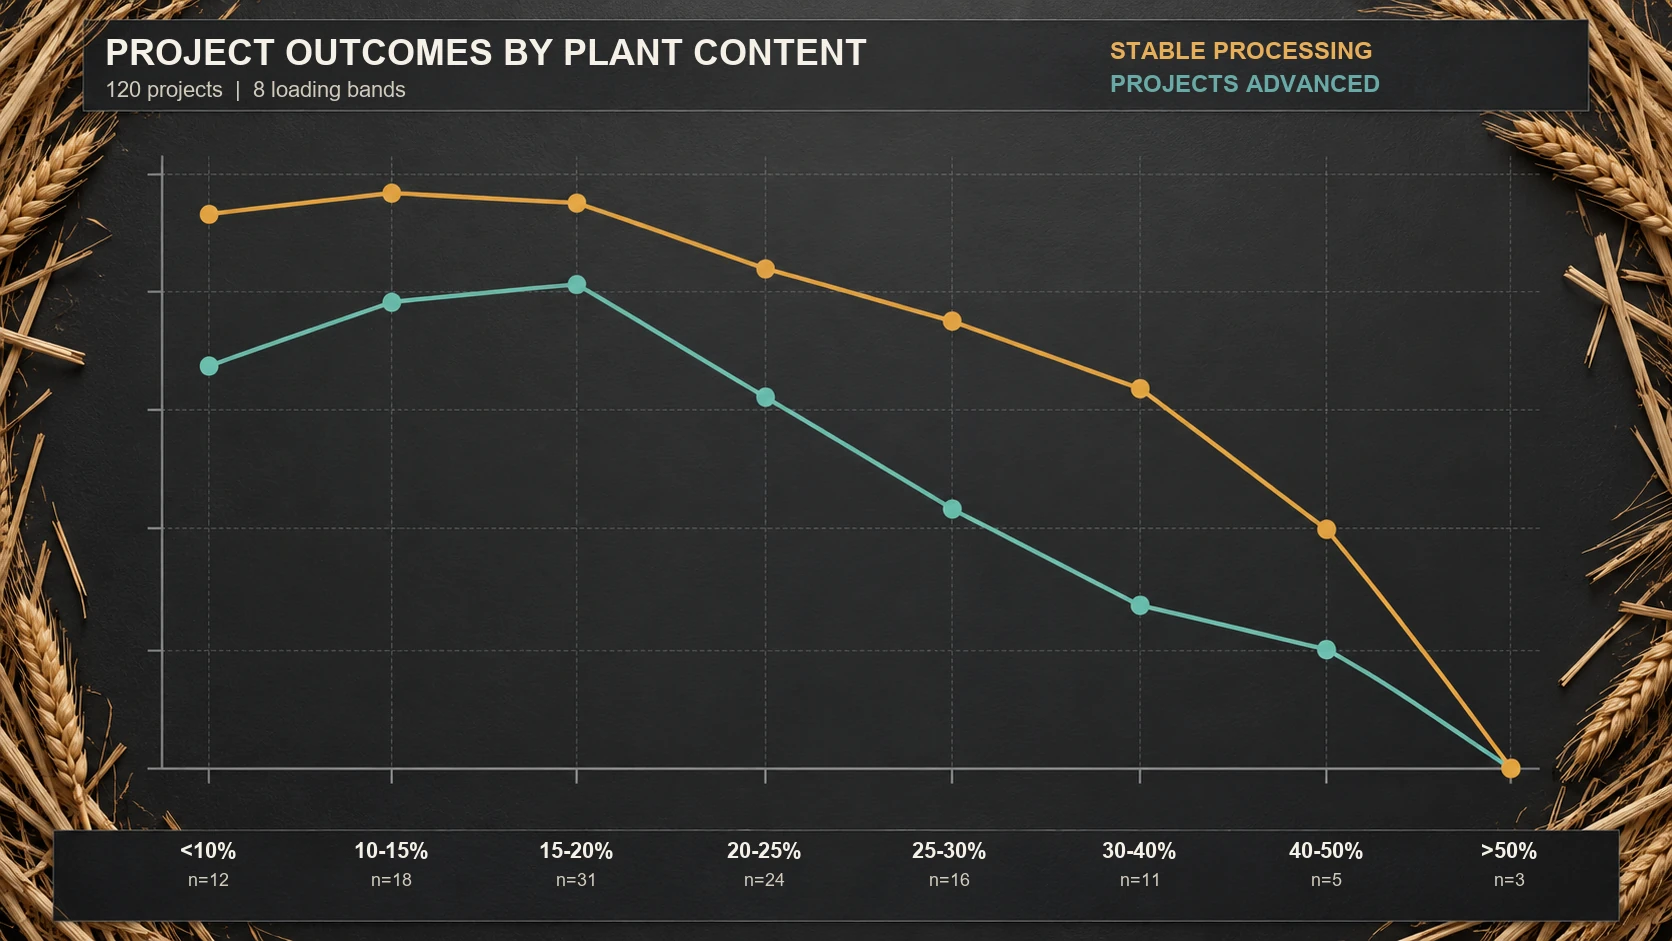
This dataset shows that plant-fiber plastic reduction has a very clear marginal change. At lower fractions, raising plant content can markedly increase petroleum-based material displacement without immediately breaking the existing processing system; beyond a certain band, every additional part of plant fiber still brings plastic-reduction benefit, but the engineering cost that has to be paid starts to rise quickly.
So "15–20% is the engineering sweet spot" does not mean that this fraction is the highest in every performance indicator, nor that a formulation above 20% is bound to fail. The more accurate reading is that, in this project sample, this band achieved both a high stable-processing rate and the highest rate of continued project advancement.
For an industrial material, those two indicators matter more than the highest plant content on its own. Only when a formulation can enter the mold, pass customer testing and keep running in production does the plastic reduction it represents actually happen.
3. Why higher loading becomes difficult
If the risk of a higher plant fraction is understood only as a marketing statement, it is often summarized simply as "lower strength". The distribution of problems across the 120 projects shows that the real situation is more complicated.
The most frequent issue was moisture uptake and damp-related problems, which involved 63 projects, or 52.5%. Natural plant fiber is itself hygroscopic, and a change in moisture content not only affects the final state of the part but also directly disturbs gas release, surface quality and dimensional stability during injection molding. For plant-fiber composites, "drying" is therefore not an ordinary process-preparation step but part of the material's performance.
Second came declining impact performance, in 58 projects, or 48.3%. A further 44 projects showed embrittlement or fracture risk to varying degrees, and 41 projects showed a drop in tensile strength. As the plant phase increases, the overall structure of the material relies more and more on the fiber–polymer interface; if interface bonding, dispersion or fiber-length control do not improve at the same time, more plant does not automatically translate into better overall performance.
Manufacturing problems were equally prominent. 57 projects, or 47.5%, needed noticeable adjustment to existing molds or processes; 52 projects showed reduced flow or mold-filling difficulties, or 43.3%; and 29 projects showed feeding-stability problems. Color difference and batch-to-batch variation in the natural appearance appeared in 46 projects, or 38.3%, and a further 33 projects showed odor problems.
This shows that once the plant fraction rises, a company is not facing a single decline in material performance but a whole production window that starts to narrow. Too high an injection temperature can char the plant fiber, while too low a temperature can make mold filling difficult; coarser fiber gives stronger natural recognition but can make surfaces and thin walls harder to mold; the higher the plant content, the more obvious the reduction in petroleum-based material, but the more sensitive the product becomes to drying, feeding and batch control.
WOOYOPET's existing published product data shows a similar processing logic. For the coffee-ground PP grade WYC-PP P179506N, for example, the website recommends drying at 100–120 °C for 4–5 hours and states clearly that excessive temperature or too long a residence time may char or carbonize the plant fiber. The material lists a tensile strength of 23 MPa, a flexural modulus of 1,250 MPa, a notched impact of 3.6 kJ/m² and an MFR of 13.5 g/10 min, so its value is not simply the highest possible stiffness but a balance between flow, natural texture and product structure.
From this angle, a genuinely effective plastic-reduction fraction is really a question of system efficiency. A material with 30% plant fiber whose production scrap rate clearly rises does not necessarily deliver a better real-world result than an 18% plant solution that is produced steadily in hundreds of thousands of parts.
4. Plant source matters, but no single plant is optimal
Among the 120 development projects, wheat straw and cereal fiber were the broadest route: 34 development projects, of which 27 reached customer sampling and 20 met the customer's initial requirements. Wood fiber involved 26 projects, bamboo fiber 24, rice husk 22, coffee grounds 18, corn or starch-based plant fillers 14, coir and coconut-shell fiber 12, and tea leaves or tea residue 9.
In terms of project advancement, wheat straw was not only the largest group but also the most balanced across several indicators. Of the 34 projects, 22 were judged able to achieve a plant fraction above 20% stably, or 64.7%; 25 projects showed good injection or extrusion stability, or 73.5%; 24 projects were rated as having good stiffness, or 70.6%; 27 projects had a natural texture with clear recognition; another 27 customers were willing to continue testing; and 20 projects eventually reached the order stage.
"Most widely used", however, does not mean "best in every performance indicator".
Wood fiber performed strongly in stiffness: 19 of 26 projects were judged to have good stiffness, or 73.1%, and bamboo fiber reached 75.0% on the same indicator. Rice husk was stronger in the perception of resource circularity: 20 of 22 projects had an easy-to-understand byproduct reuse story, or 90.9%. Coffee grounds stood out in consumer recognition: 15 of 18 projects showed strong natural-texture recognition and 17 had a clear circular-use story.
This shows that different plants play different roles. Wheat straw is more like a relatively balanced, scalable general route; bamboo fiber and wood fiber have more obvious structural-performance potential; the advantage of coffee grounds lies more in consumer perception, natural color and the byproduct story; and rice husk combines the status of an agricultural byproduct with a high level of consumer understanding.
Even for the same plant, a different treatment can produce a clearly different performance. Two of WOOYOPET's published wheat-straw / cereal-fiber PP materials are a typical example. The refined WYC-PP P179002N reaches a tensile strength of 31 MPa, a flexural strength of 55 MPa, a flexural modulus of 1,956 MPa and a notched impact of 3.8 kJ/m²; the other grade, P179050, puts more emphasis on coarse plant particles and high flow, with a tensile strength of about 18 MPa but an MFR of up to 15 g/10 min, against roughly 9.5 g/10 min for P179002N. The latter suits products with higher requirements for a light appearance and overall performance, while the former can play to its strengths in products with long flow paths or where a coarser plant visual is more acceptable.
"This is a wheat-straw material" is therefore not enough to describe a material. Fiber particle size, screening method, treatment, final content, compatibilizer system and processing history can all change the final performance.
5. Published grade data: the plant name is only the first variable
The performance differences between plants are even more visible in the grades WOOYOPET already publishes. Bamboo-fiber PP WYC-PP P179203 lists a tensile strength of 35 MPa, a flexural strength of 62 MPa, a flexural modulus of 2,420 MPa and a notched impact of 4.0 kJ/m²; wood-fiber PP WYC-PP P179302 lists 32 MPa tensile strength, a 2,210 MPa flexural modulus and a 4.5 kJ/m² notched impact. By comparison, coffee-ground PP P179506N lists a tensile strength of 23 MPa, a flexural modulus of 1,250 MPa and a notched impact of 3.6 kJ/m².
If only structural performance is considered, bamboo fiber and wood fiber have the advantage in this group of published PP materials; but coffee-ground material has a more distinct dark natural appearance, higher flow and a byproduct source that consumers understand very easily. Engineering optimum and market optimum are therefore not always the same thing.
The base polymer also changes the conclusion. Using bamboo fiber in a PP system gives a tensile strength of 35 MPa and a flexural modulus of 2,420 MPa, while the published bamboo-fiber ABS data reaches 40 MPa tensile strength, 73 MPa flexural strength and a 2,800 MPa flexural modulus. The ABS system also has lower molding shrinkage, which makes it a better starting point for precision housings, snaps and assembly parts.
Coffee grounds show the same pattern. Coffee-ground PP lists a tensile strength of 23 MPa, a flexural modulus of 1,250 MPa and a notched impact of 3.6 kJ/m², while coffee-ground ABS WYC-ABS PA757520 reaches 30 MPa, 2,230 MPa and 6.8 kJ/m² respectively. For products that need higher dimensional precision and housing stiffness, changing the base polymer is sometimes more effective than simply raising or lowering the plant content.
On the other hand, if a product needs more flexibility and yield room, wheat-straw PE WYC-PE P179WT020 offers another material direction. It lists a tensile strength of 24 MPa, an elongation at break of 8%, a flexural modulus of 1,050 MPa and a notched Izod impact of 16 kJ/m². Because this grade uses the ISO test system, its impact figure cannot be ranked directly against the ASTM data above, but it clearly shows a product positioning for the PE matrix that is completely different from PP and ABS.
These published data further show that this survey can hardly conclude that "one particular plant fiber is best". The more reasonable industrial judgement is: first determine what the product needs, then choose the plant, the base polymer and a sensible fraction — rather than first choosing the plant that sounds most environmentally friendly and then trying to force it into every product.
6. Buyers want substitution, with a firm performance floor
The 50 B2B brand, manufacturing company and project contacts gave another very representative set of results. Asked why they consider plant-fiber materials, 44 chose "reduce the use of petroleum-based plastic", or 88%, the highest of all options. 39 mentioned brand ESG or sustainability goals, or 78%; 35 wanted to differentiate products through a natural appearance, or 70%; 33 wanted to build a new environmental product line, or 66%; and 31 were interested in using agricultural or food-processing byproducts, or 62%.
This shows that companies adopt plant fiber not only because of consumer marketing. Genuinely reducing the use of conventional resin has become a very direct project goal.
When the question turned to "what worries you most", however, the ranking went straight back to performance. Of the 50 customers, 41 worried about declining impact or drop performance, or 82%; 36 worried about lower product strength, or 72%; 34 were concerned about water resistance and moisture uptake, or 68%; 33 worried about plant-related color difference and batch consistency, or 66%; 32 worried about higher cost, or 64%; and 31 worried about unstable injection or extrusion, or 62%.
More telling are the conditions under which companies would really adopt the material. 42 customers required that product life must not decline, or 84%; 40 required impact and structural performance to meet the existing standard, or 80%; 38 wanted existing equipment to remain basically unchanged, or 76%; and 35 wanted existing molds to keep working or need only minor adjustment, or 70%.
By comparison, only 18 people, or 36%, chose "end consumers can clearly perceive the natural material".
This result matters. For a brand, natural texture and an environmental story are plus points, but they are not the first threshold a product must pass to reach an order. What a company first wants to confirm is whether the original product can still do its job.
This also explains why the advancement rate at 15–20% on the material side is higher than in the more heavily filled bands. Companies do not wish to remove less plastic; in real purchasing they are responsible at the same time for quality complaints, molds, production efficiency and product life.
On the question of a "reasonable plant fraction", 20 of the 50 B2B respondents chose 10–20%, or 40%; 17 chose 20–30%, or 34%; only 6 chose 30–40% and 1 chose above 40%. In other words, 74% of these judgements fall within the 10–30% range. What the industry really needs is not the highest plant content but a plant content that can be produced continuously.
7. Consumers prefer 20–30% if the product still works
If 15–20% is the range the material side can most easily achieve, the consumers' answers are clearly more ambitious. Among the 200 consumers, faced with four "plant fraction versus performance" options, 38 chose about 10% plant content with performance very close to ordinary plastic, or 19%; 84 chose about 20–30% plant content while everyday performance is maintained, or 42%, the largest group.
46 people, or 23%, were willing to go further and choose 35–40% plant content even if some impact or processing performance may decline; 22 were willing to choose a high plant fraction above 50%, or 11%; and a further 10 could not judge.
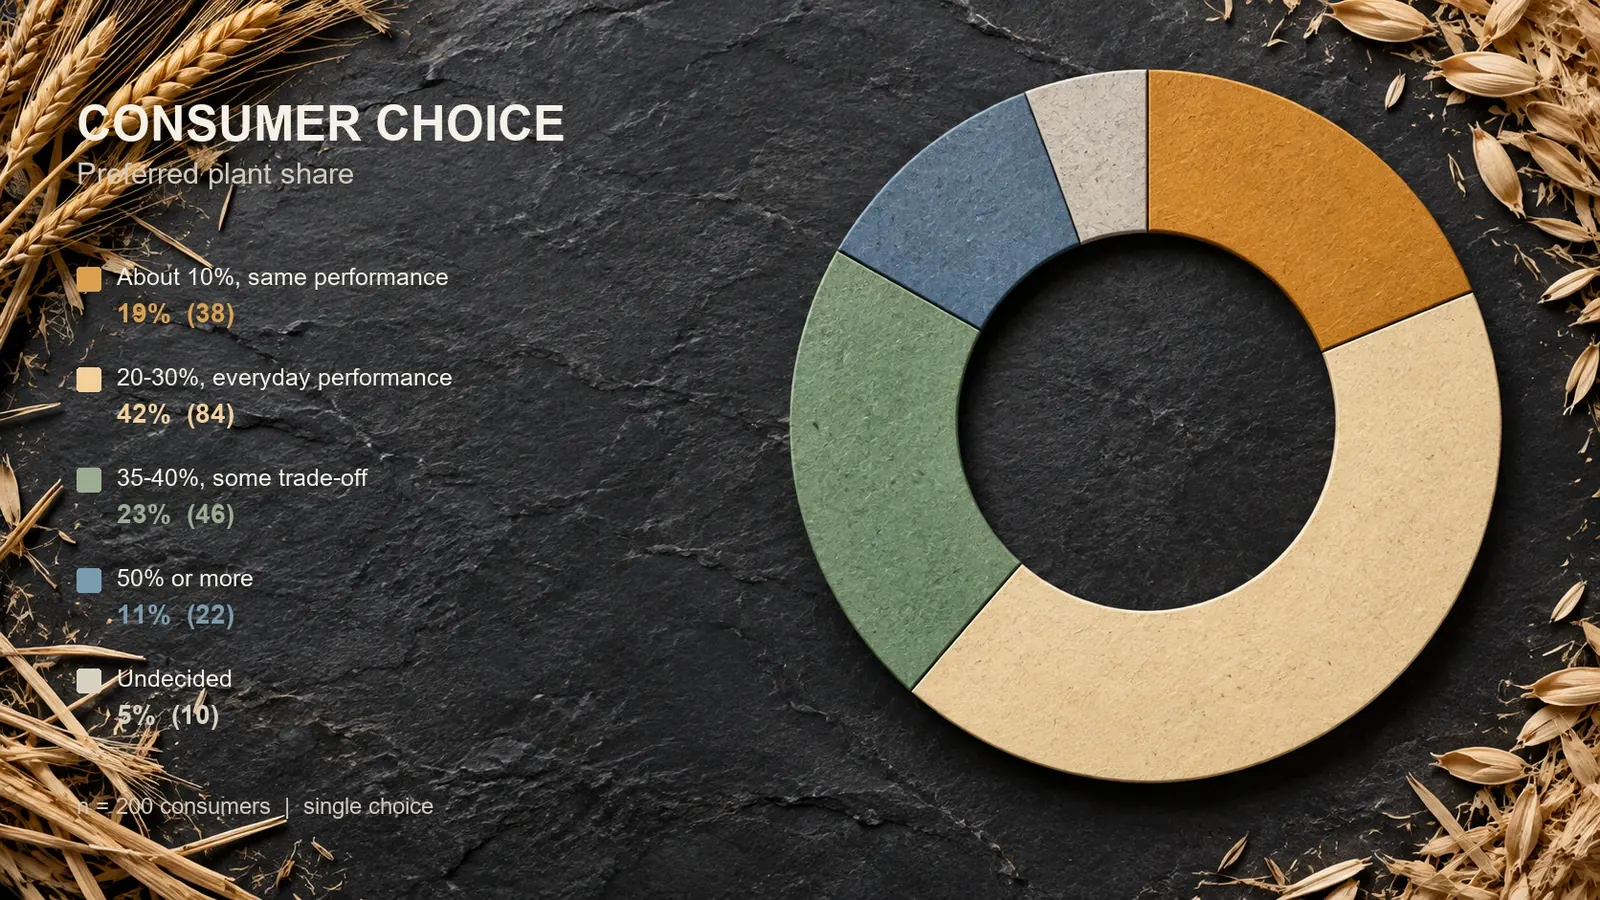
This result forms a valuable industrial signal: the level of plant content consumers expect is higher than the level material projects can currently achieve stably.
Consumers want to see 20–30%, and some are willing to accept more; the highest advancement efficiency on the material side, however, is concentrated at 15–20%.
This does not mean a company should simply push every project from 18% to 25%. Instead, those five to ten points can be understood as the target space for the next stage of formulation development. If better fiber treatment, interface design, base-polymer selection and process control can gradually extend today's 15–20% stability to 20–30%, the environmental value and the market perception of the material could rise together.
But consumers being willing to accept a higher plant content does not mean they are willing to accept a clearly worse product.
That is very obvious in another group of questions. Among the 200 consumers, 70.5% could accept a surface feel slightly different from ordinary plastic, 68% accepted visible plant particles or fibers, 64% accepted some natural color difference, 59% could accept a slight change in stiffness that does not affect function, and 56% could accept a product that is about 5% heavier.
All of these are cases of "the material becoming different".
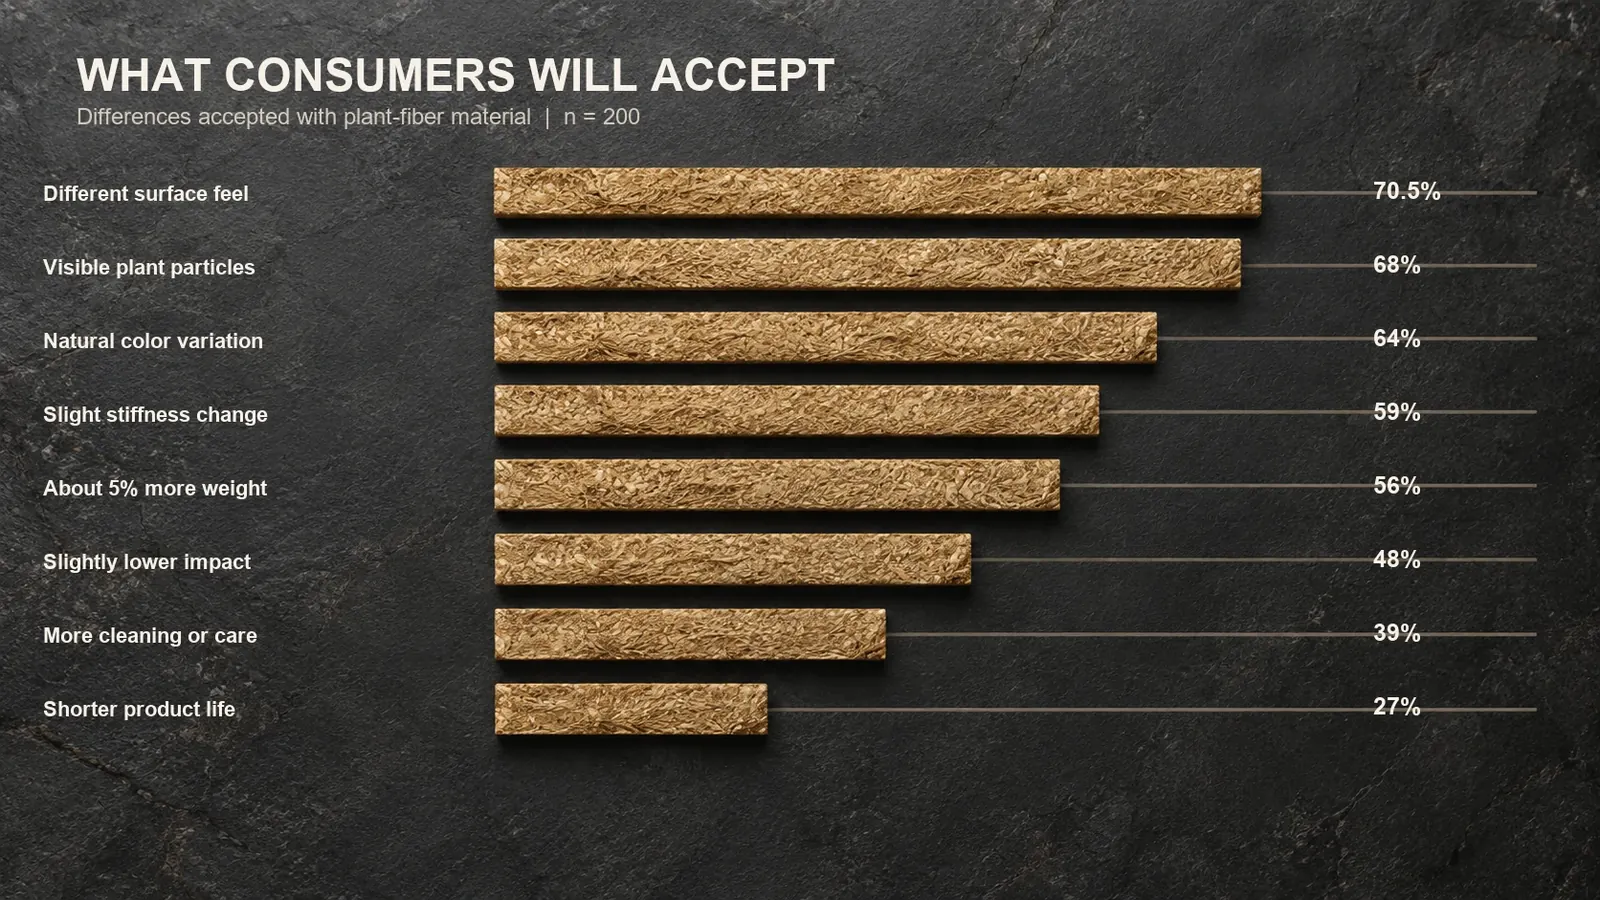
Once a change touches the real function of the product, however, acceptance falls quickly. Only 48% would accept a slight decline in impact performance, only 39% would accept more cleaning or maintenance in exchange for less plastic, and only 27% would accept a slightly shorter product life.
In the same way, 52% of consumers could accept a price increase of about 5%, but when the increase widened to 10%, acceptance fell to 31.5%.
This dataset may deserve more industry attention than a simple statement that "consumers support environmental protection": consumers are willing to accept the differences that plant fiber brings, but they are not willing to accept an obvious downgrade of the product.
A small change in color is acceptable. A feel that is not exactly like plastic is acceptable. Visible fiber particles may even be a plus. But impact performance, service life or a reasonable price should not be clearly sacrificed in the name of "environmental protection".
This is in fact highly consistent with the judgement of the B2B customers. Brands worry that the product will get worse, and consumers likewise do not want environmental protection to become the reason why a product gets worse.
8. Product risk should set the target
Consumer attitudes to the plant fraction also change clearly with the type of product. For disposable tableware, 44% of consumers wanted the plant fraction to be as high as possible and only 18.5% put performance first. For planters and gardening products, 39% wanted the fraction as high as possible and another 36% chose around 20–30%.
What these products have in common is that consumers place relatively low demands on extreme impact, precision assembly and long-term dimensional stability, so they are more willing to trade for a higher plant fraction.
Pet food bowls begin to show a different trend. 23% wanted the plant fraction as high as possible, 41% considered 20–30% appropriate, and another 29% said the fraction itself is not important and performance should come first.
Once products move into electrical appliances, smart devices and automotive applications, the ranking reverses. For appliance housings, 48% of consumers chose "the fraction is not important, performance comes first"; for smart pet device housings and bases it reached 50.5%; and for car interiors it reached 54%. Outdoor products also had 49% putting performance ahead of the plant fraction.
This shows that "how much plant fiber to add" is itself an application question.
For low-risk products such as planters and disposable items, a fraction of 30% or even higher may be worth exploring actively; for products with snaps, drop requirements, water resistance, dimensional fit or long-term weathering requirements, the sensible fraction has to be more conservative.
A responsible plastic-reduction strategy should therefore not prescribe one plant content for every product. The closer a product is to a structural part or a long-life durable, the more performance should decide the fraction; the closer it is to a non-load-bearing, short-cycle or natural-look product, the more room there is to raise it.
9. Annual volume can matter more than the single-part percentage
Project data become more intuitive in real products. A 186 g PP pet food bowl uses an 18% rice-husk plant fraction and is produced 350,000 times a year. About 33.48 g of each part is carried by plant material, corresponding to roughly 11.72 tonnes of material substitution over the year.
A 95 g wheat-straw PP litter scoop uses a 15% plant fraction and is produced 500,000 times a year. Each part displaces only about 14.25 g, but the annual cumulative figure reaches about 7.13 tonnes.
A 420 g bamboo-fiber ABS storage box uses a 20% plant fraction; the theoretical substitution is 84 g per part and, at an annual output of 80,000 units, corresponds to about 6.72 tonnes.
The coffee-ground PP cup lid is even more typical. A single lid weighs only 12 g and the plant fraction is 15%, so each lid theoretically reduces the original polymer by only about 1.8 g. Because annual production reaches 2,000,000 units, however, the cumulative annual substitution still reaches about 3.6 tonnes.
A wood-fiber pet comb handle uses a 25% plant fraction, weighs 78 g per part and is produced 200,000 times a year, corresponding to about 3.9 tonnes of material substitution.
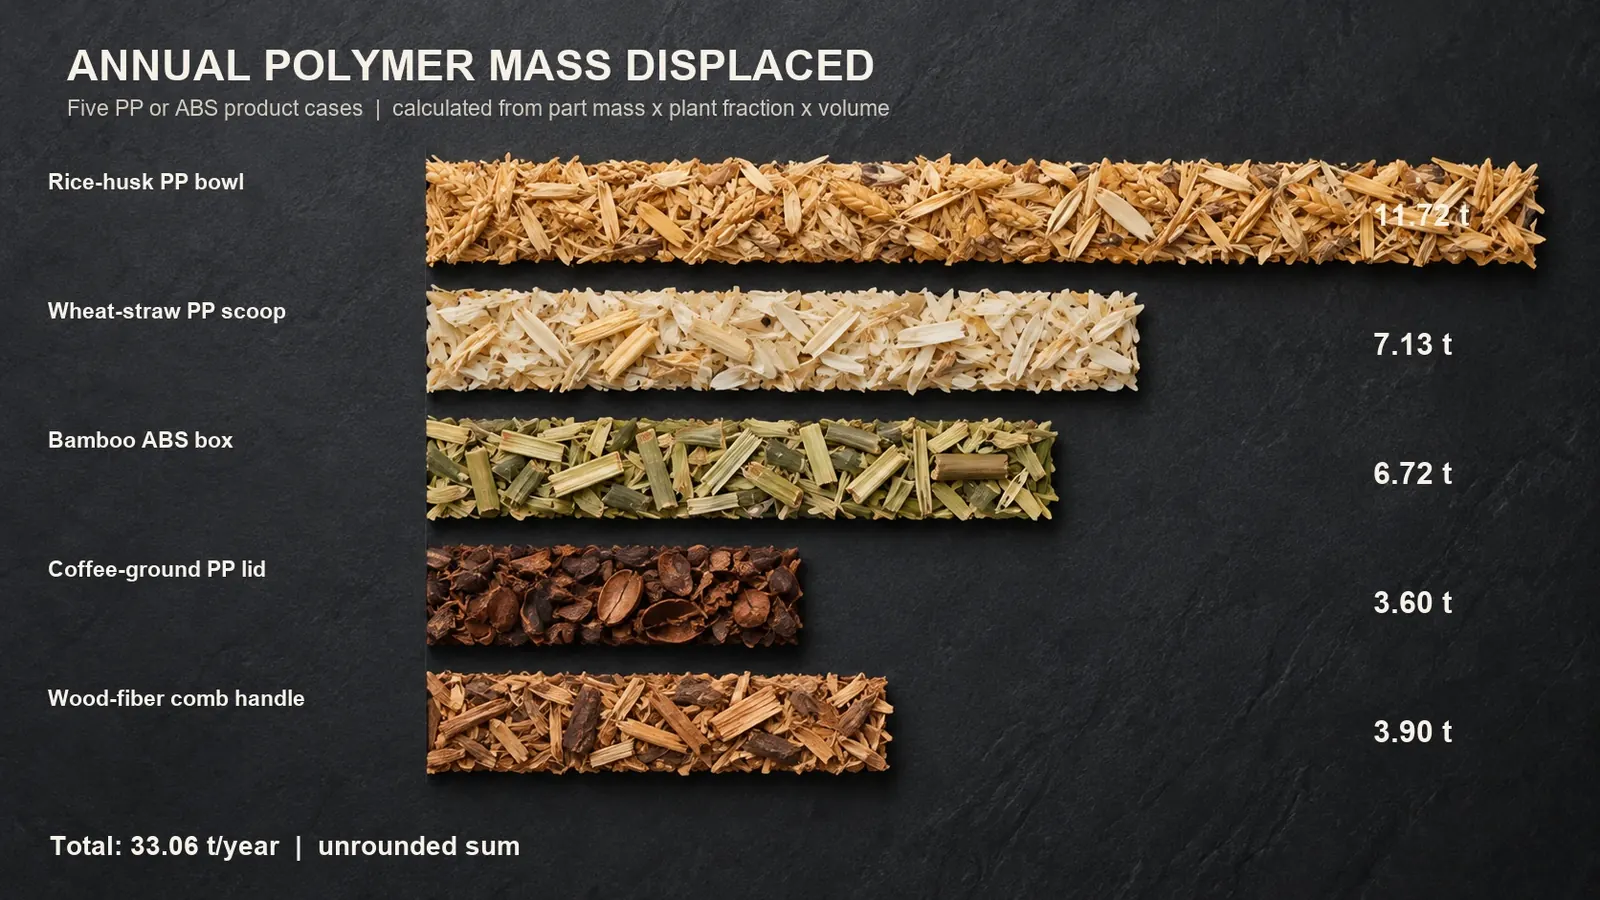
The first five projects, which use conventional PP or ABS matrices, add up to a theoretical petroleum-based material substitution of about 33.06 tonnes per year.
A sixth project, a wheat-straw disposable-tableware case, uses a PLA+PBAT system with a 30% plant fraction and can reduce about 7.2 tonnes of polymer matrix in material-mass terms, but because the fossil origin of the PLA/PBAT system itself differs from ordinary PP and ABS, this project should not be combined directly with the first five cases to calculate "petroleum-based plastic displacement". It is better evaluated on its own as a "polymer reduction" project.
This looks like a mere question of statistical scope, yet it illustrates a common misunderstanding that material reporting should avoid: the plant fraction is not equal to the petroleum-reduction fraction, and still less to the carbon-reduction fraction. The origin of the material has to be accounted for separately. If the original matrix already contains bio-based polymer, then "adding 30% plant" and "reducing fossil plastic by 30%" are not the same concept at all.
10. Failed trials show the boundary
If only successful mass-production cases are shown, it is easy to form the illusion that as long as plant material is put into plastic and some engineering adjustments are made, a product can always be made. Real projects are not like that.
A pet food bowl project initially wanted to add 40% rice husk. The project stopped at the impact test after injection molding, because the fracture risk brought by the high rice-husk fraction could not meet the customer's standard. The R&D team tried reducing the fraction to 20%; performance improved clearly but still did not reach the customer's final requirement, and the customer finally moved to a PP+15% wheat-straw solution.
Another project, a coffee-ground cup lid, initially aimed at 35% coffee grounds, but the odor and color difference caused by the high fraction could not meet the brand's requirements. After the fraction was reduced to 15%, odor and color control improved clearly and the customer finally accepted the PP+15% coffee-ground route.
An outdoor product project even tried 50% wood fiber in the hope of cutting conventional plastic substantially, but ran into obvious problems with moisture uptake and dimensional change. Even after reducing the fraction to 25%, it still could not meet the long-term dimensional requirements of that outdoor product, and the project finally returned to glass-fiber-reinforced PP.
This case is especially worth discussing. Judged purely by "plant content", glass-fiber PP is obviously not the prettier environmental story. But if a plant material cannot meet the long-term service requirements of the product, forcing its use is not necessarily the more responsible option. Reducing plastic should not mean reducing product life at the same time.
This may be one of the boundaries this survey most needs to emphasize: plant fiber is a tool for reducing plastic, not a material faith that every product must adopt.
11. Wheat straw is the most widely used, not the best for every product
Looking at the coverage of the 120 projects, the conversion into orders and the plant-source choices of the 200 consumers, wheat straw does show a relatively strong overall advantage.
In the single-choice question asking which plant source consumers would most willingly choose when performance and price are equal, wheat straw received 48 votes, or 24%, ranking first; bamboo fiber received 35 votes, or 17.5%; coffee grounds 31 votes, or 15.5%; rice husk 26 votes, or 13%; and wood fiber 22 votes, or 11%.
This corresponds to some extent with the project side, where wheat straw had the largest number of development projects and the largest number reaching the order stage.
The more accurate industry conclusion, however, should be that wheat straw is currently a route with broad coverage that makes it relatively easy to build both engineering and consumer awareness — not a "best answer" that can replace every other plant fiber. If a product emphasizes stiffness, bamboo fiber and wood fiber may be more suitable; if the byproduct communication story matters, coffee grounds have a unique advantage; if the product wants consumers to understand the second use of agricultural resources intuitively, rice husk also has a very strong basis for recognition; and in some applications that need flexibility, the choice of matrix can matter even more than the plant source. A truly mature material system should not pursue "choosing the one best plant" but should build a matching logic between plant source, matrix, fraction and product requirements.
12. Evidence consumers trust
The 200 consumers were also asked what kind of plastic-reduction information they find most credible. The first-ranked answer was "clearly state the plant source", chosen by 156 people, or 78%. 149 wanted to know how many grams of petroleum-based plastic a single product displaces, or 74.5%; 142 paid attention to third-party material or safety testing, or 71%; 138 wanted the brand to publish the plant fraction, or 69%; and 118 believed that showing the real material source and production process increases credibility, or 59%.
By comparison, only 21 people, or 10.5%, thought that writing "Eco-Friendly / environmental material" is enough.
Life-cycle assessment was also chosen by 87 people, or 43.5%, lower than simple material origin, plastic-reduction volume and third-party testing.
This does not mean consumers do not care about carbon footprint; it means that different information has a different threshold of understanding. "This product contains 18% rice husk." "It reduces 33 grams of conventional polymer per part." "The rice husk comes from a food-processing byproduct." "This material has passed the relevant product safety test." Consumers can understand this information immediately.
By contrast, a complete LCA requires a clear system boundary, transport, the electricity mix, the plant pretreatment method and product life, and not every ordinary consumer can judge it directly. For the plant-fiber industry, therefore, material transparency may matter more than simply using an environmental label.
13. Conclusion: three tests for effective plastic reduction
Placing the data of 120 material projects, 50 B2B customers and 200 consumers together produces a conclusion far more complex than "the more plant, the better".
In the current project sample, 15–20% is the most stable band on the engineering side, with a 93.5% stable-processing rate and the highest rate of continued customer validation or actual use at 80.6%. Above 20% the project success rate starts to fall; above 30%, processing, impact, moisture and dimensional risks grow further.
Consumers, however, want to go one step beyond the current engineering position. 42% of consumers see 20–30% plant content as the ideal option, higher than the 19% who chose the 10% option. This means the market wants to see more obvious plastic reduction, while the material side still has to solve the performance problems behind those five to ten points.
The answers of the B2B customers form the boundary. 84% of customers require that product life basically does not decline, 80% require that the original structural and impact performance continues to meet the standard, and 76% want existing equipment to need no replacement. Companies support plastic reduction, but what they really need is a material that can enter the existing manufacturing system, not an environmental experiment that requires redesigning the whole product logic.
Consumer attitudes are very close to those of the companies. They are willing to accept natural color difference, visible plant particles, a different feel and even a small increase in weight and price, but once product life, an obvious impact decline or a larger price increase is involved, acceptance falls quickly.
The real industrial value of plant-fiber composites may therefore not lie in setting a record for the "highest plant content". It should pursue another result: in a product that would have been produced anyway, find the part of the petroleum-based plastic that can be removed reliably, and let that change repeat hundreds of thousands or millions of times.
For some products that answer may be 15%. For others it may be 25%. Planters, disposable items and non-load-bearing products can explore higher fractions, while precision housings, car interiors and outdoor structural parts may need to be more conservative. Material has no single best plant content, because products themselves do not have a single set of use conditions.
Genuinely effective plastic reduction should not be defined by the highest plant fraction but tested against three criteria. First, whether the reduction in petroleum-based material really happens. Second, whether the product can still do its original job. Third, whether the solution can keep entering manufacturing at scale. When the answer to all three is yes, plant fiber stops being only an environmental concept. It truly becomes a plastic-reducing material.
Research and calculation notes
The research framework of this report is divided into three independent samples: material projects, B2B customers and end consumers. The material-side scope covers plant-fiber material projects that reached customer validation; different plant sources may be compared within the same project, so plant-source coverage may be counted more than once. The B2B sample and the consumer sample are counted independently and do not contain each other.
Grade properties are quoted from WOOYOPET's published product information. Test methods, base polymers, fiber treatments and formulations are not fully consistent between materials, so the data are used to illustrate differences between material routes and should not be read as a strict ranking obtained under identical experimental conditions.
The "petroleum-based material displacement" in the cases in this article is calculated with the mass model of product weight × plant fraction × annual production volume. That indicator describes mass substitution of material and is not directly equivalent to a carbon-emission reduction rate. Polymer systems from different sources, such as PLA and PBAT, cannot be treated with the ordinary PP or ABS petroleum-based substitution logic and should be accounted for separately according to the actual matrix composition.